Go to Pearson Annual Report home page [Accesskey '0']| Go to content [Accesskey '1']| Go to main menu links [Accesskey '2']| Go to footer links [Accesskey '3']| Go to site map page [Accesskey '5']| Go to accessibility page [Accesskey '6']
Pearson
- Introduction
- Strategy
- Performance
- Responsibility
- Governance
- Financials
- Other info
- Always learning
Annual Report and Accounts 2010
- Introduction
Financial highlights
In financial terms, Pearson’s goal is to achieve sustainable growth on three key
financial goals – earnings, cash and return on invested capital – and reliable
cash returns to our investors through healthy and growing dividends. Over the
past five years we have produced, on average, 16% growth in earnings and cash
flow. And we have sustained our growth even in the face of very tough
economic and market conditions in recent years.
Business performance and Statutory results
| 2010 £m |
2009 £m |
Headline growth |
CER growth |
Underlying growth |
|
|---|---|---|---|---|---|
| Business performance | |||||
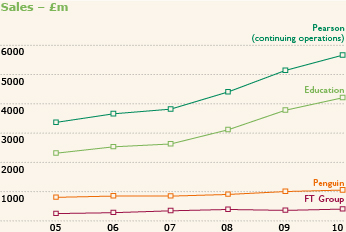
| Sales | 5,663 | 5,140 | 10% | 8% | 5% |
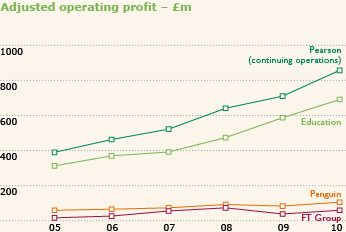
| Adjusted operating profit | 857 | 710 | 21% | 15% | 14% |
| Adjusted profit before tax | 853 | 761 | 12% | ||
| Adjusted earnings per share | 77.5p | 65.4p | 19% | ||
| Operating cash flow | 1,057 | 913 | 16% | ||
| Total free cash flow | 904 | 723 | 25% | ||
| Total free cash flow per share | 112.8p | 90.5p | 25% | ||
| Return on invested capital | 10.3% | 8.9% | 1.4%pts | ||
| Net debt | (430) | (1,092) | 61% | ||
| Statutory results | |||||
| Operating profit | 743 | 619 | 20% | ||
| Profit before tax | 670 | 523 | 28% | ||
| Basic earnings per share | 161.9p | 53.2p | 204% | ||
| Cash generated from operations | 1,169 | 1,012 | 16% | ||
| Dividend per share | 38.7p | 35.5p | 9% |
Notes:
Throughout this document:
- a) Growth rates are stated on a constant exchange rate (CER) basis unless otherwise stated. Where quoted, underlying growth rates exclude both currency movements and portfolio changes.
- b) Interactive Data is treated as a discontinued business and sales and operating profit are stated on a continuing business basis, excluding Interactive Data from both 2009 and 2010. Until its sale on 29 July 2010, Interactive Data contributed revenues of £296m (full year 2009: £484m) and adjusted operating profit of £81m (2009: £148m).
- c) The ‘business performance’ measures are non-GAAP measures and reconciliations to the equivalent statutory heading under IFRS are included in notes 2, 8 and 31 to the annual report.
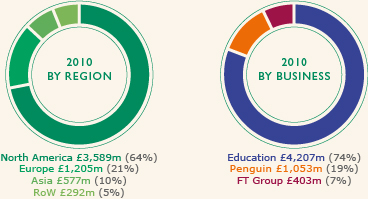
2010 Sales
£5.7bn
+8%
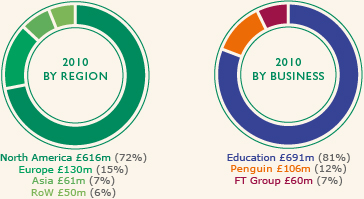
2010 Adjusted operating profit
£857m
+15%
Our record
Average annual growth in headline terms, 2006–2010
Adjusted earnings
per share
per share
+16%
Operating cash flow+16%
Download annual report