Pearson
- Introduction
- Strategy
- Performance
- Responsibility
- Governance
- Financials
- Other info
- Always learning
Financial overview: 2010
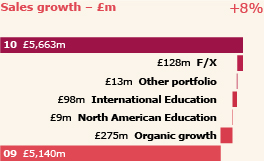
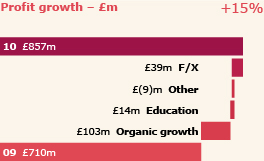
In 2010, Pearson’s sales increased by 10% in headline terms to £5.7bn and adjusted operating profit by 21% to £857m. The headline growth rates include a benefit from currency movements and acquisitions. Currency movements added £128m to sales and £39m to operating profit. This was the result of the strengthening of the US dollar and other currencies against sterling: we generated approximately 60% of our sales and profits in US dollars and the average exchange rate strengthened from £1:$1.57 in 2009 to £1:$1.54 in 2010. At constant exchange rates (ie stripping out the benefit of those currency movements), our sales and operating profit grew 8% and 15% respectively.
Acquisitions, primarily in our education company, contributed £120m to sales and £5m to operating profits. This includes integration costs and investments related to our newly-acquired companies, which we expense.
Our underlying revenue and operating profit (ie stripping out the benefit of both portfolio changes and currency movements) grew 5% and 14% respectively.
The disposal of Interactive Data was completed on 29 July 2010. Interactive Data therefore contributed seven months of profit in 2010, compared to a full twelve months in 2009. Pearson’s total operating profit increased 9% in headline terms to £938m, reflecting this part-year contribution from Interactive Data in 2010.
Our tax rate in 2010 was 25.2%, a little lower than in 2009. We increased adjusted earnings per share by 19% in headline terms to 77.5p.
Cash generation
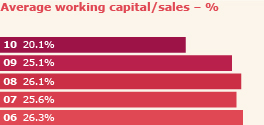
We increased operating cash flow by £144m to £1,057m (headline growth of 16%) and free cash flow by £181m to £904m, or 112.8p per share (headline growth of 25%). We converted 113% of operating profit into cash, with our average working capital: sales ratio improving by a further five percentage points to 20.1% as we benefited from the rapid growth in our digital businesses and continued efficiency improvements.
Return on invested capital
We improved our return on average invested capital by 1.4 percentage points to 10.3%, benefiting from strong profit growth and tight control of working capital as well as the part year contribution from Interactive Data.
Statutory results
Our statutory results show an increase of £124m in operating profit to £743m (£619m in 2009). Basic earnings per share were 161.9p in 2010, up from 53.2p in 2009, helped by the profit on disposal of Interactive Data.
Balance sheet
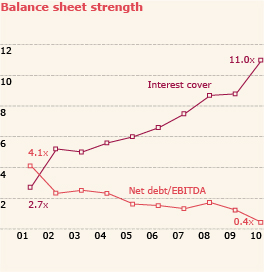
We significantly reduced our net debt by £662m to £430m (£1,092m in 2009). We benefited from the proceeds from the sale of Interactive Data and strong cash generation, partly offset by acquisition investment of £535m and sustained investment in our businesses. Since 2000, Pearson’s net debt/EBITDA ratio has fallen from 3.9x to 0.4x and our interest cover has increased from 3.1x to 11.0x.
Dividend
The board is proposing a dividend increase of 9% to 38.7p, subject to shareholder approval. 2010 will be Pearson’s 19th straight year of increasing our dividend above the rate of inflation and our fastest rate of growth in a decade. Over the past ten years we have increased our dividend at a compound annual rate of 6%, returning more than £2.3bn to shareholders. We have a progressive dividend policy of sustaining our dividend cover at around 2.0x over the long term while moving our dividend growth more in line with earnings growth.
Download annual report

Watch case studies